Cabbage Logo
Back to Cabbage Site

Fftdisplay and the display opcode (and Lissajous)

Hi,

I tried the display opcode with the new fftdisplay. I think it works. The only thing is that you only get to see half of the wave. Would it be possible to add a “waveform” option to the “displaytype” parameter so that the range is -1 to 1 instead of 0 to 1?

Thanks.

I never even thought to try this. That’s a happy accident. I guess we should probably discuss whether it would be better to create a new generic display widget that supports ‘spectrogram’, ‘spectroscope’ and ‘waveform’?

[edit] I’ve added a waveform display type to the fftdisplay.

But it doesn’t really make much sense in that widget. I propose a new signaldisplay widget which can be used to display signals as FFT or time-pressure graphs. fftwidget will still work as before. They will effectively be the same widget. When a user type fftdisplay Cabbage will actually create an signaldisplay widget. Or should I just call it display?

Nice!

I think the question will be then: are we are ever going to implement something else that is also a “display”? Otherwise, “signaldisplay” seems redundant.

I’ll try to think of any other “display” that could be useful in a software like Cabbage.

I think it’s probably best to be as specific as possible as it makes the code more readable? If a user sees signaldisplay they know immediately what it’s for. Whereas display seems a little ambiguous to me.

If you can configure it in xy mode, it would be really cool!

R

Sorry, I don’t follow? I’d be happy to explore adding an XY mode if I knew what that was!

Hi,

the Lissajous figures appear only thanks to this oscilloscope mode. It must have 2 signals: 1 viewed normally and the other phase-shifted by 90°. best if you look here:

https://courses.engr.illinois.edu/ece110/content/labs/Modules/LissajousFigures.pdf

https://www.picotech.com/library/oscilloscopes/xy-display-mode

R

Pardon me, I didn’t pick up the reference to Lissajous figures. I have to admit, I’ve never really explored these.

Two signals, two unique signals, or will a copy of a single waveform phase shifted and plotted on the Y axis also work? I’m just trying to figure out how to implement it. Does the widget have to receive two completely independent signals? That would be a pain to implement, but if all I need to do is plot a phase inverted version of a signal against the original than it shouldn’t take long to implement at all.

Hi,

(no problem!!!)

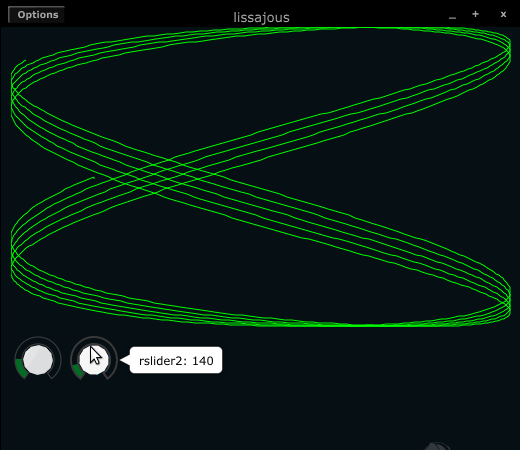
Look my code (Cabbage for Lissajous tool curves Generator) and known as the two audio channels are independent: L generated one signal and R generated another signal (I added the possibility to change waveform for each channel). If the two signals are equal, the frequency ratio would be 1:1 only the circle is generated (sine wave for both). If you change the ratio, the circle begins to move, and when the frequency ratio becomes at another integer values, different figure is generated… (I’m sorry, but explain in english is very difficult for me…).

the signals have to be different to create shapes… certainly we have to send the two audio signals to the widget. It must be stereo (…), this way open another possibility for this widget: you can build a Cabbage tool that gives the possibility to choose which channel to view: L, R, both or XY :scream: (for mastering application is very nice)

R

Well, “signaldisplay” it shall be then. It is indeed a more accurate term and it’s only 6 letters of redundancy that you are only going to write once in the code.

Disclaimer: I know nothing about Lissajous curves except for some Youtube videos I just saw about the subject.

If you know the sample rate at which the display is working, can’t you mathematically model a composite waveform to represent Lissajous curves with only a single signal?

What I mean is, if you know the refresh rate of the 'scope, can’t you send a stream of silences-wave representation-silences so that it draws the curves in the center?

Thanks @Codesound, I’ll take a look at this and see what can be done. I have some ideas. I will use your instrument to base my experiments on. @gsenna, I’m not sure I follow your thinking on this. I guess it would be possible to create a secondary waveform from the original, but it probably defeats the purpose of the tool in the first place? I don’t know. I think we’re both a little in the dark on this one. I guess I’m about to learn a lot more about it though :wink:

By using two display opcodes I’m able to retrieve two unique signals that I can use to draw the Lissajous curves. But it’s a bit of a CPU hog in comparison to other drawing methods. The actual drawing method is not that much different than the waveform one, but each line segments is much longer now. I’ll see if I can tidy it up.

Beautiful work!

Tahnks Rory! This open many GUI possibilities… thanks for your patience!

R

U can give this file example for me ?

Hmm, it doesn’t seem to be working right now. I’ll need to take a look. I was sure it was updated when I moved to Cabbage 2 but it looks like it wasn’t thoroughly tested.