I was trying some basic envelopes in those synths I made and I think i’ve found a bug. In my code I have:
gentable bounds(32, 4, 190, 192), channel("pos","end"), tablecolour("yellow"), identchannel("table1"), startpos(-1), outlinethickness("2"), tablebackgroundcolour(79, 135, 78, 32), tablegridcolour(82, 233, 82, 15), tablenumber(212), amprange(0, 1,212, 0.1)
My table is being defined as:
f 212 0 1025 -07 0 100 .8 825 1 100 0
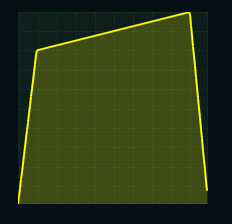
When I run the code I see that the graph doesn’t end in 0 (see the attached picture). I’ve also found out that I can correct the bug if I add ‘samplerange (0, 1025)’ to the gentable definition.
Am I using the widget incorrectly or is it a bug?
P.S.: Shall we use github for reporting bugs now? Should we first try to get an answer in the forum and only if you (Rory) confirm that the behavior is unexpected we report the bug in github?
edit: I’ve found out that with a table size of 100 I have to use “samplerange(0, 101)”. So it’s evidently not calculating the size of the display correctly by default and so it hides the last value shown. Maybe there is a size+1 in C++ that is missing?