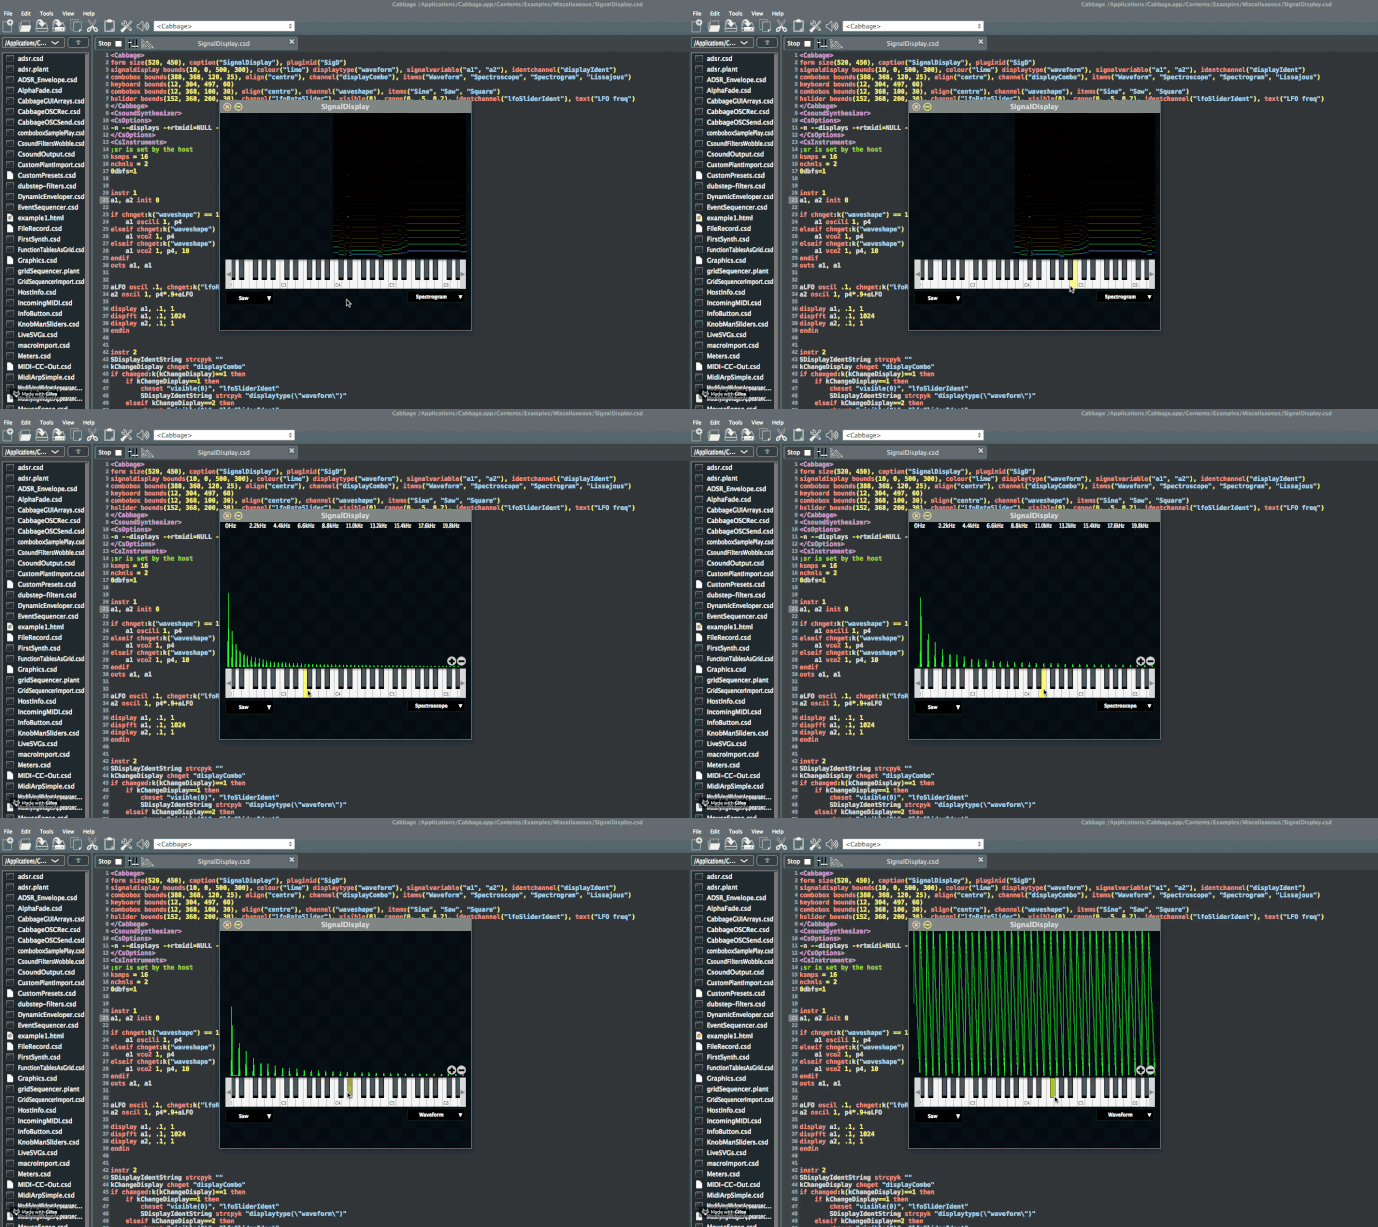
Dispfft opcode how do you implement it and display using a cabbage widget I looked at signal display but this does not seem to support as I think it only displays a waveform🤔
Dispfft opcode
You should be able to select between display types in that example?
Hello all - this is my first post on the forum!
I believe I can shed some light on gerardotrance’s query. Indeed, there is a mismatch between the documentation and the true functionality of the SignalDisplay widget. Luckily, there is a workaround.
The docs claim that the SignalDisplay widget can display an FFT spectrum passed from csound using the dispfft opcode. You are supposed to be able to do this by correctly setting the widget’s signalvariable() identifier to the correct variable, also by setting the identifier displaytype(“spectrogram”) or displaytype(“spectrograph”). Then, by sending the correct variable as the input to dispfft in the Csound code, SignalDisplay is supposed to display the spectrum. However, there is no example in the docs that demonstrates this mode. The example on the SignalDisplay docs page only shows off the displaytype(“waveform”) way of using SignalDisplay, which obvious has nothing to do with FFT.
I created my own example to show how this is supposed to work. If the docs are to be believed, all we have to do is take the simple example from the SignalDisplay page, and make these changes:
- Change
displaytype("waveform")todisplaytype("spectrogram")in the<Cabbage>section - In the Csound code, change the line
display asig, .5, 1todispfft asig, .1, 2048as per the Csound manual entry for the dispfft opcode.
Ok, now we should be able to run the example and we should see the FFT spectrum displayed where before we saw the waveform displayed.
In reality, this doesn’t work. The SignalDisplay widget just goes blank. It appears that in fact the widget doesn’t work with the dispfft opcode at all and is currently not capable of displaying a FFT spectrum.
Ok, now for the workaround. If you take a look at the example file under File>Examples>Utilities>FFTSpectrum, you can see how an FFT spectrum can be displayed using a gentable widget, an fsig generated by pvsanal, and the tablenumber() identifier.
Here is how to modify the SignalDisplay example to use a gentable widget to display an FFT spectrum.
- Add a gentable widget with an identchannel() identifier (so Csound can send to Cabbage and update the display), a tablenumber() identifier, and an amprange(). The amprange identifier has to be set so that the max and min of the gentable display matches the amplitude range of the signal you want to display. For example, if your signal will be normalized (between -1 and 1) then do
amprange(0,1,-1). Here’s the Cabbage code I used:
gentable bounds(0, 38, 400, 200) identchannel("display") tablenumber(1.0), amprange(0.0, 1.0, -1.0, 0.0100) - Add these lines to the instrument you are using to display the spectrum (which in our example will be instr 1):
iDisplay ftgen 1,0,1024,-2,0 ;create the table
fsig pvsanal aSig, 2048, 512, 2048, 1 ;analyze the signal
kflag pvsftw fsig, iDisplay ;write the spectrum to the table
if kflag==1 then ;if there is new data
chnset "tablenumber(1)", "display" ;make Cabbage update the display
endif
All credit goes to Iain McCurdy for inventing this method; I took it directly from his more complicated FFTSpectrum example and in some case directly copied and pasted his code. Some notes:
- The f-table created with
ftgenmust match the value in thetablenumber()identified in the gentable widget. So in this example, that’s f-table 1. - Whatever FFT number you are going to use, the ftable created must be half that size. So in my example, I am using an FFT number of 2048 (the second input parameter of the
pvsanalopcode) so I made f-table 1 have a size of 1024. IIRC the table can actually be larger than needed and the remaining locations will just be filled with zeroes. - kflag is 1 when there is new data to be processed, otherwise 0. The if/then statement uses this behavior to ensure that the display is only updated when it needs to be.
- You can study the FFTSpectrum example to see a slightly more complex implementation in which the FFT size can be changed on the fly by the user and the table is automatically reinitialized.
Hope this helps and please let me know if anything is confusing!
SignalDisplay in the Misc/Examples shows how to do this.
That being said, I probably do need to update the docs. And thanks for posting this anyway, it’s always good to present people with alternative ways of doing things. Btw, what version of Cabbage are you using? It might be that the displaywidget is not quite right in your version?
I’m using version 2.3.0. And yeah I missed that example file under Misc. It works for me, so I was wrong about the SignalDisplay not working.
But I still don’t understand why it didn’t work when I tried modifying the Widgets>SignalDisplay example. Presumably a misunderstanding on my part. Later when I get the chance, I’ll look carefully at the Misc>SignalDisplay example and figure out where I went wrong.
Edit: Could my first attempt at using SignalDisplay not have worked because I used 2048 for the dispfft window size? Is it a requirement to use 1024?
Edit: No, that’s not it, because when I change the Misc>SignalDisplay example so that dispfft uses 2048 as a window size, it has no problem. I just can’t figure out why my example doesn’t work but that one does. I would post the full text of my modified example (it’s just the Widgets>SignalDIsplay example with a couple lines altered as described in my above post), but I’m confused about how to post large blocks of code here.
You can attach a .csd file, or you can paste a large block of code, and that select it and hit the format pre-formatted text button to convert it to code. Post the modified SignalDisplay instrument and I can take a look…


