gentableXAxis1.csd (685 Bytes) gentableXAxis2.csd (510 Bytes)
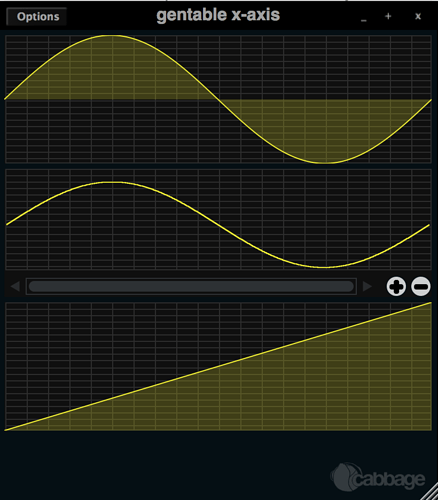
I find getting gentable to render an x-axis for any sort of a bipolar function table a bit of a negotiation. In the first attached example three tables are created:
i_	ftgen	1, 0, 8192, 10,1
i_	ftgen	2, 0, 16384, 10,1
i_	ftgen	3, 0, 4096, 7, -1, 4096, 1
The first one renders fine.
The second one, because of the increased table size, renders as if is unipolar. A horizontal scrollbar is also created inspite of zoom(-1) being requested. It seems that some sort of limit is crossed after 8192.
The third table should also be rendered as bipolar but is rendered as unipolar.
Here’s what it all looks like:
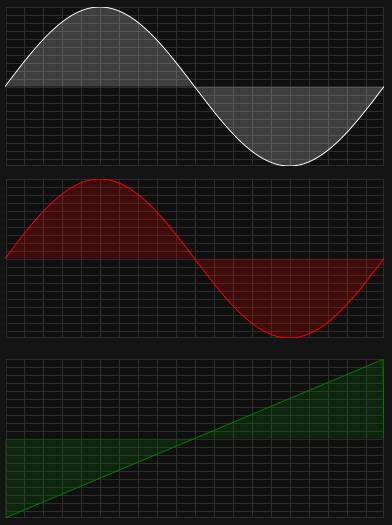
A far from ideal workaround for the third table is to create it using the form of table 1 and then overwrite it using the desired GEN07 shape in an instrument (shown in example 2).


