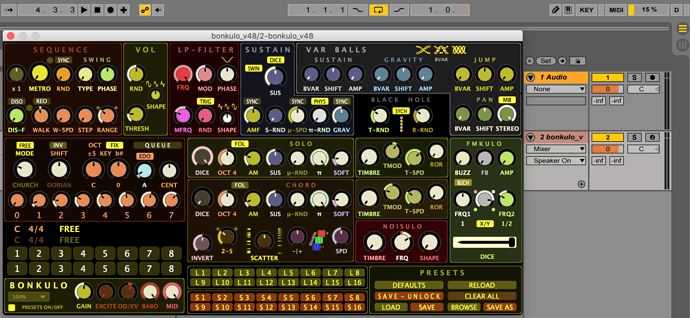
When your plugin runs (it’s very nice btw!), the same level of CPU is seen when the editor is open, and when it is closed. When I muted disabled the metro, and let it get quite the CPU dropped right down to 0. So I put a breakpoint in the process block function and it wasn’t getting called at that point. So it seems that Live has some way of dynamically enabling/disabling plugins to free up CPU. At least that is my read. Otherwise there is no reason in the world it would stop calling the process block function.
I also ran the instrument through the profiler. No surprise that the opcode hit the most is cabageGetValue
. You do query a lot of channels on each k-cycle? The following is one such example right?
kSaveOFFTrig[] fillarray \
trigger(cabbageGetValue:k("IO_SavePar1"),0.5,1),\ ;1->0
trigger(cabbageGetValue:k("IO_SavePar2"),0.5,1),\
trigger(cabbageGetValue:k("IO_SavePar3"),0.5,1),\
trigger(cabbageGetValue:k("IO_SavePar4"),0.5,1),\
trigger(cabbageGetValue:k("IO_SavePar5"),0.5,1),\
trigger(cabbageGetValue:k("IO_SavePar6"),0.5,1),\
trigger(cabbageGetValue:k("IO_SavePar7"),0.5,1),\
trigger(cabbageGetValue:k("IO_SavePar8"),0.5,1),\
trigger(cabbageGetValue:k("IO_SavePar9"),0.5,1),\
trigger(cabbageGetValue:k("IO_SavePar10"),0.5,1),\
trigger(cabbageGetValue:k("IO_SavePar11"),0.5,1),\
trigger(cabbageGetValue:k("IO_SavePar12"),0.5,1),\
trigger(cabbageGetValue:k("IO_SavePar13"),0.5,1),\
trigger(cabbageGetValue:k("IO_SavePar14"),0.5,1),\
trigger(cabbageGetValue:k("IO_SavePar15"),0.5,1),\
trigger(cabbageGetValue:k("IO_SavePar16"),0.5,1)
I wonder would you get better performance now with the new cabbageChanged
opcode. It this case alone it would lead to 30+ less calls to different opcodes. Worth a shot. But in general I don’t think the CPU is bad considering what it does.