

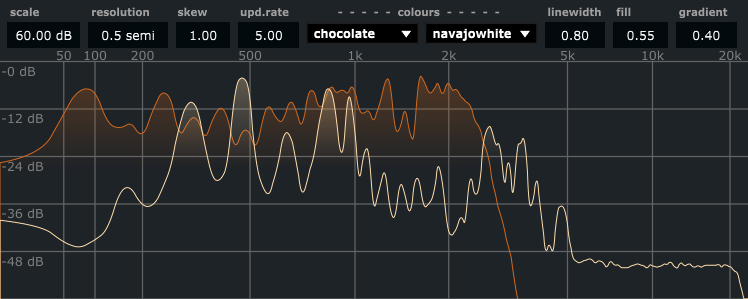
Here’s a spectral display based on pvs data and using SVG path for the display graph. I did some tweaking to reduce the data for display, aiming for a roughly logarithmic frequency axis with a slight modification in the low end. The display resolution can be set in semitones. colours and gradients can be used to better separate displays of simultaneous signals (e.g. stereo, or displaying the modifications done by a pvs process etc.).
Code here:
https://github.com/Oeyvind/spect_display
Screenshot:
4 Likes
awesome
A brilliant example of svgElement(). And a nice solution to the question posed here Possible to scale FFT Spectrogram Display?
Beautifully done!
Wonderful! Thank you for sharing the csd.
I’m playing around with this again here and I can’t believe how well it works. Even when I fire up the update rate it still chugs along very well. Hats off to you @Oeyvind, you’ve boldly gone where no Cabbage-er has gone before ![]()
Thanks so much. Makes me happy to hear it’s working😎