

I’m wondering if theres a way to display the fft signal display so that the freqs are more exponentially distributed? Right now, most content I feed into it (guitar, full mixes etc) is shown only at the very bottom making it hard to see the distribution. I assume this is because it’s displaying linearly?
And I assume your assumption is correct ![]() I thought there might be something in the Csound
I thought there might be something in the Csound display opcode that might help, but it looks like we might need to roll our own. I take it you’re using the signaldisplay widget rather than drawing your own FFT?
Yes I’m using the signaldisplay widget
Right, leave it with me ![]()
Thanks. I was able to get a better display by setting the min/max bins on the fftdisplay opcode but it’s a hack and not accurate.
Another thing I’m having a small issue with. The Gentable seems to load only the first value of a table. After mouse click it populates the rest of the table.
Can you prepare a simple .csd file? I just tried a few gentable examples here and couldn’t recreate this issue.. ![]()
gentableTest.csd (682 Bytes)
Sure!
It looks like gentable isn’t clever enough to handle a single value being passed to GEN02 when the table size is 64. I’ll have to take a look at the source. I tried a few simple things here to trick Cabbage into getting over this, but none of them seemed to work. I’ll let you know. I’m still trying to sort out the log view for the spectrogram. I thought that would have been easier to add ![]()
The problem here is that the Csound API function for retrieving the values of a table only returns a single 0.7, followed by a collection of 0s. I’ll need to prepare an example for the Csound devs so they can look into it as it is something that needs to be addressed on the Csound end of things. I wonder if what you are trying to do can’t be achieved with an SVG element and an image widget? If I understand correctly, you would like to draw 64 vertical lines based on the position of the mouse in drag mode?
It looks like something changed in Csound. IIRC, GEN02 used to fill all remaining samples with whatever the last given amplitude is. But it doesn’t seem to do this anymore. So you need to manually fill each index with 0.7. The following will work:
gigraph ftgen 101, 0, 64, -2, 0.7

opcode FillTable, 0, i
    iAmp xin
    iCnt init 0
    while iCnt < 64 do
        tabw_i iAmp, iCnt, 101
        iCnt += 1
    od
endop

instr 1
    FillTable .7
endin
[edit] Joachim Heintz just pointed out on the Csound list that we can just fill an array, and then pass the array to ftgen ![]()
1 Like
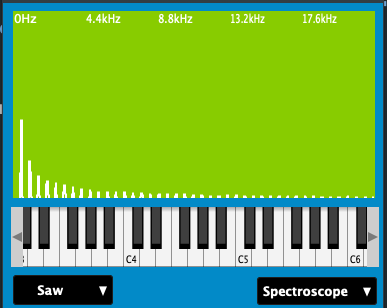
Regarding the spectroscope, this is how it looks normally:
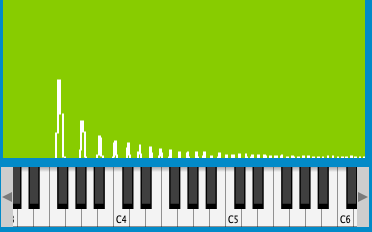
And this is how it looks when the value are presented in a logarithmic fashion:
Does this look Ok? To be honest, it’s a horrible spectral viewer anyway. I wonder if we’re not just wasting time with this. Have you checked out the SVG FFT example? I think it makes a far prettier spectral viewer than the signaldisplay widget.
Btw, I haven’t pushed that change yet as I’m not entirely sure I’ve done it right…
Here’s a version using the SVG element and an image. Seems to be right when I display the frequencies on a mouse over.. ![]() This is a sawtooth waveform btw.
This is a sawtooth waveform btw.
FFT_LOG_SVG.csd (2.5 KB)
Right. According to the manual(f Statement (or Function Table Statement))
The simplest way to fill a table (f1) with any single value is:
f1 0 xx -7 yy xx yy
where xx = table size and yy = any single value
I am specifically using the spectroscope (not gram). I also checked out that example but didn’t try it with a scope implementation - if it’s even possible? The existing spectroscope yields pretty minimal visual feedback and (fwiw) the simplicity of the widget is a more elegant solution as I try and minimize lines of code. I am trying to reverse engineer (to some extent) NI’s Spektral Delay and wanted to have the same type of display they used.
Seem that this will work for everything but GEN02 where you must specify each value. I’m almost 100% certain we discussed this on the Csound list many years ago. But we no longer have access to any of those posts so I can’t prove it ![]()
Yes, the examples I presented are all spectroscope rather than gram? I’ll check out the NI stuff and see what we can do..
I just pushed through that update. There is now a skew identifier that can be used to set the amount of logarithmic scaling. I updated the signaldisplay widget example too so you can see how it works. A value of 1 gives linear scaling, moving upwards from there will result in log scaling. It’s still pretty rough but it might do the trick for you. I couldn’t really find any decent video or overviews of the NI Spektral plugin. It seems to be discontinued. But hopefully this is enough to keep you going.
Yeah it’s been discontinued since 2007 I think ![]() That’s why someone needs to make it again!
That’s why someone needs to make it again!
Will check the changes - is that pushed to Pro too? Didn’t see it there.
Sounds like a plan!
No, best to check it out on the public version first and we can see if it works Ok. If so I can build you a pro version.
Hi,
I’ve been trying out different methods to create a spectrum display in Cabbage. I also would like to do overlays in that display, to show the frequency bands where a filter is active and such things. It looks like the spectrum display can be done both with gentable and with signaldisplay. Do you have thoughts on which one to prefer for different use cases?
What I found
-
signaldisplay does not look so nice, and I could no figure out how to customize it. It seems it is easier to make gentable look nice (?)
-
signaldisplay also seems to show different amps (y axis) for different pitches. For example in the SignalDisplay.csd from Cabbage Examples, if I play different notes on the keyboard, they will show in different heights on the y axis. In the test I used Sine waveform and Spectrocope display. I am guessing it is an artifact from the fft analysis, but I could not find a way to remedy the behaviour.
-
signaldisplay has a skew argument that can be used to make it display frequency on a logarithmic scale. That is very useful. I could not find a way to do that with gentable. Currently investigating how I can massage the array of amps so that the array itself represents the scaling/skewing I want. Perhaps I can use the mfb opcode for this. Or we might need an opcode to rewrite an array from linear to log distribution of the amp values (?)
-
if I want overlays (showing several arrays/tables superimposed in the same display), I just have to use gentable (right?)
-
I discovered the SVGelement example just now, and it looks nifty and flexible. How does it compare to gentable in terms of CPU load?
The SVG way is doing it if not too bad in terms of CPU. I was surprised the last time I benchmarked it. I would use the SVG method as it gives the best looking results. Did you see the FFT example I posted? You could probably start by hacking that.